The case for caste census in India (GS Paper 2, Social Justice)
Why in news?
- After the publication of a caste survey in Bihar, which found that 63% of Bihar’s 13 crore population belong to castes listed under the Extremely Backward Classes (EBC) and Other Backward Classes (OBC) categories, Prime Minister criticised and rejected the demand for a nationwide caste census made by Congress and several other Opposition parties.
What do socio-economic data indicate?
- The intersection between class and caste-based deprivation in Indian society is evident in a gamut of socio-economic statistics.
- The average monthly per capita consumption expenditures (MPCE) of Scheduled Tribes (ST), Scheduled Castes (SC) and OBC households in rural areas were, respectively 65%, 73% and 84% of the MPCE of the ‘Others’, i.e. the general category, as per the National Sample Survey (NSS), 2011-12.
- In urban areas the average MPCE of ST, SC and OBC households were 68%, 63% and 70% of the general category in 2011-12.
- The persistence of inequality across caste categories in India can also be seen in the multidimensional poverty estimates based on the National Family Health Survey (NFHS-4/2015-16).
Estimate by NIT, Rourkela:
- A research paper by scholars from NIT, Rourkela has estimated that while on average 25% of Indians were multidimensionally poor in 2015-16, the poverty ratio among STs was 44.4%, SCs 29.2%, OBCs 24.5% and Others 14.9%.
- As per this estimate, while STs, SCs and OBCs taken together comprised around 73% of the Indian population, they accounted for 84% of the country’s poor. Over 50% of India’s multidimensionally poor belonged to the OBC category.
Estimate by OPHI:
- Estimates by scholars from the Oxford Poverty and Human Development Initiative (OPHI) show that while almost 28% of all Indians were multidimensionally poor in 2015-16, the poverty headcount ratio among STs was 50.6%, SCs 33.3%, OBCs 27.2% and Others 15.6%.
- As per this estimate, while STs, SCs and OBCs taken together comprised around 77.6% of the Indian population in 2005-06, this share increased to almost 84% of the country’s poor in 2015-16.
- The multidimensional poverty headcount ratio among Muslims at 31% was also higher than that of Hindus (28%), Christians (16%) and other religious communities (15.7%).
- The Sachar Committee report (2006) had estimated that 31% of Muslims were ‘Below Poverty Line’ on the basis of the NSS 61st round, 2004-05, while the poverty headcount ratio among SCs & STs together was 35%, Hindu OBCs 21% and other Hindus (general category) 8.7%. Methodologies of poverty estimation have changed significantly in the past two decades, suggesting a significant decline in the poverty level.
- However, the disproportionate concentration of poverty among the STs, SCs, OBCs and Muslims in India have remained stable over time.
- This clearly indicate that discrimination and exclusion based on caste via-a-vis STs, SCs and OBCs as well as religion, particularly with regard to Muslims, have a causal relationship with poverty and deprivation.
What about education and employment?
- The pattern of caste-based deprivation can be clearly seen in official data on education and employment indicators. The general category has a much higher proportion of literates, secondary and high school pass outs, graduates and post-graduates than OBCs, SCs and STs.
- As per NSS 75th round (2017-18), while only 3% of STs, 4% of SCs and 6% of OBCs are graduates, the proportion of graduates in the general category is over 12%.
- The proportion of post-graduates within the general category is over 3%, among OBCs around 1% and among SCs and STs, below 1%.
- In terms of employment status (PLFS 2021-22), over 30% of the workforce in the general category had a regular job, while the proportion of regular or salaried workers among OBCs and SCs was around 20% and among STs just over 12%. In contrast, almost 29% of STs, 38% of SCs and 20% of OBCs were casual labourers, against only 11.2% of the general category.
- This indicates that the informal sector is largely populated with STs, SCs and OBCs while the general category has a disproportionately large share of formal employment.
Employment:
- The Central government itself is one of the largest employers in the formal sector, employing over 18.78 lakh persons as on January 2021, as per union government data, 52.7% of whom belonged to the general category.
- The proportion of employees in the general category is much greater at over 64% in the most qualified and highest paid cohort, i.e. Group A employees.
- This indicates that the persistence of caste-inequality in educational outcomes is reproducing a similar pattern of caste-inequality in skilled, formal employment, even three decades after the official implementation of the Mandal Commission recommendations. The demand for a nationwide caste census has gathered momentum in this backdrop.
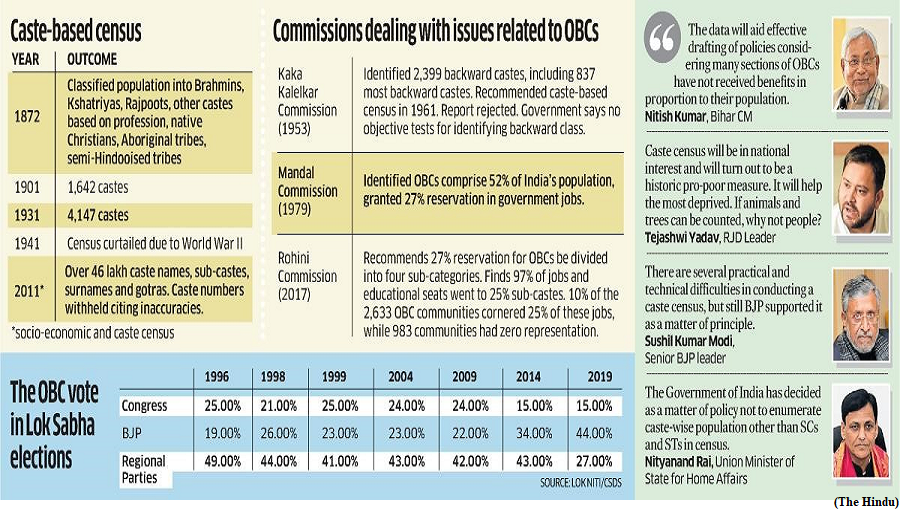
When did caste surveys begin?
- Caste wise enumeration of the population was introduced under the British colonial administration in 1881 and continued till the 1931 census.
- Independent India’s governments abandoned full caste enumeration on the apprehension that it would strengthen caste divisions and perpetuate the caste system.
Mandal Commission report:
- The report of the Backward Classes Commission headed by B.P. Mandal was submitted to the President of India on December 31, 1980.
- The Mandal Commission report had extrapolated from the caste/community-wise population figures of the 1931 census and estimated the combined population of Hindu and non-Hindu OBCs to be 52% of India’s population.
- The commission had also arrived upon a crucial conclusion, that “caste is also a class of citizens and if the caste as a whole is socially and educationally backward, reservation can be made in favour of such a caste on the ground that it is a socially and educationally backward class of citizens within the meaning of Article 15(4).”
- Article 15(4) of the Constitution enables the State to make special provisions for the advancement of “socially and educationally backward classes of citizens.”
- While the population share of OBCs was estimated at 52%, only 27% reservation for OBCs in all government services, technical and professional institutions was recommended by the Mandal commission, in order to keep the overall reservation for SCs, STs and OBCs together below the 50% ceiling set by the Supreme Court.
What did Indra Sawhney judgement ensure?
- The V.P. Singh government implemented 27% OBC reservation for public services in 1990 and following legal challenges, the Supreme Court upheld it in the Indra Sawhney & others versus Union of India judgment in 1992 with the significant observation: “Identification of a group or collectivity by any criteria other than caste, such as, occupation cum social cum educational cum economic criteria ending in caste may not be invalid.”
- This cleared the way for OBC reservation in public employment and educational institutions in India.
- The demand to resuscitate full caste enumeration in the national census has arisen as a corollary of these historical developments.
Why is there opposition to a caste census?
- Opposition to a nationwide caste census has been aired from some quarters on the ground that the revelation of the exact population share of OBCs greater than or equal to 52%, as estimated by the Mandal commission, would trigger demands for enhancing the 27% reservation quota for OBCs.
- Such demands, however, were already set into motion following the enactment of the Constitution (103rd Amendment) Act, 2019, which provided 10% reservation to “economically weaker sections” (EWS) within the general category in admission to public and private educational institutions as well as civil posts and services.
- The law breached the 50% ceiling on reservation and faced legal challenges, but was ultimately upheld by a majority judgment of the Supreme Court in November 2022. The Chief Justice of India also dismissed a review petition against the judgment in May 2023.
- With the Supreme Court itself validating reservation quotas beyond the 50% threshold, the demand for expanding OBC reservation beyond the 27% Mandal commission threshold has naturally arisen, because the 27% figure was derived as a residual from the 50% threshold after adjusting the quota for SCs and STs. It never had any basis in population estimates.
What should be the way forward?
- Given the wide divergence of the OBC population thrown up by various official sample surveys ranging from 41% to 46%, between 2015-16 to 2021-22, only a full caste enumeration can help in ascertaining an accurate number.
- More importantly, ascertaining the numbers and proportions of individual castes within the OBC category have assumed much significance in the light of concerns regarding reservations and other benefits for OBCs getting concentrated among certain dominant caste groups.
- The Bihar caste survey for instance, shows that 122 small caste groups combined together in the EBC category, accounted for 36% of the state's population, which was the largest share among social categories.
- A nationwide socio-economic caste census is necessary to evolve scientific criteria for such sub-categorisation. This would also be necessary for all States, which have their own State-level OBC lists, given the wide variety in caste composition.